A knowledge graph for the World Resources Institute, built by 40 volunteers with no manager
For the World Resources Institute, an Omdena team of more than 40 volunteers from 15+ countries turned the websites of three forest-restoration platforms into a knowledge graph of who works on which climate hazards, with which solutions and partners. The brief was vague, nobody assigned the work, and the off-the-shelf models fell short. This case study covers how the problem was understood, how the pipeline worked and what it left unsolved.
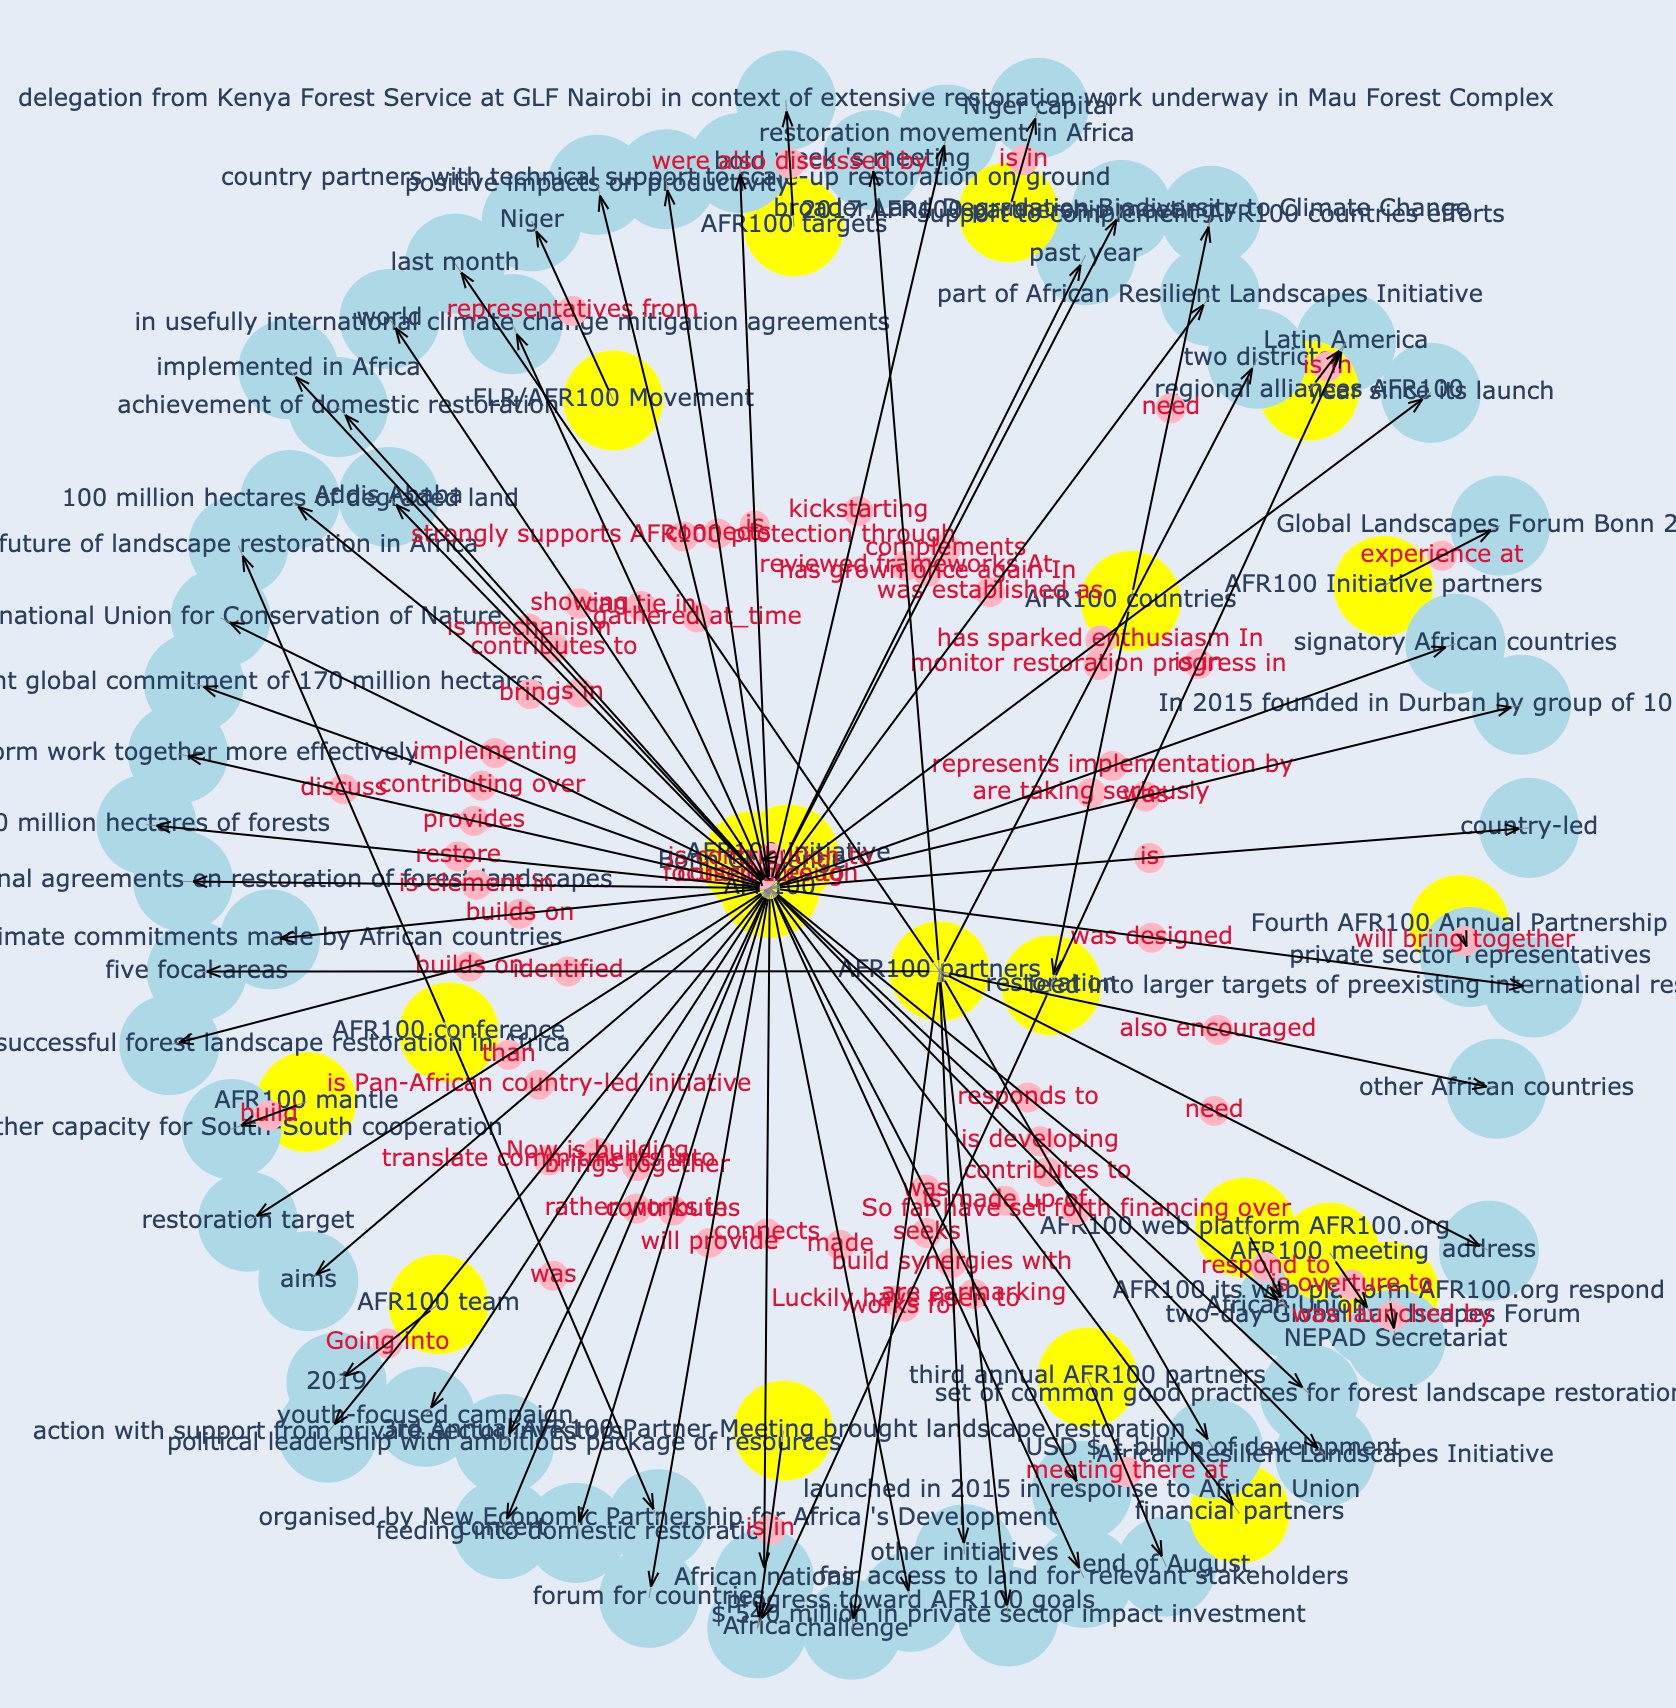
At the World Resources Institute (WRI), the question in late 2020 was simple to state and hard to answer: across the organisations restoring forests and mangroves as a defence against climate change, who was tackling which hazards, with which solutions, alongside which partners? Until then, that kind of evidence came from local interviews, gathered by hand as social-science research usually is. WRI brought the question to Omdena, where 40 to 60 volunteers from around the world spend a couple of months building AI for a nonprofit or startup, with no manager assigning the work.
The project ran from October to December 2020, on evenings and weekends alongside a full-time backend job at Rakuten and the year spent teaching machine learning for Google Crowdsource.
The pressure: a vague brief, messy sources and no manager
The starting direction was open on purpose. The kickoff notes said the work was "still early stage, feel free to play with the existing data", and that anyone who wanted to join an effort should "take initiative". Three things made it hard:
- The sources were scattered. The team was given the websites of three restoration platforms, AFR100, Initiative 20x20 and Cities4Forests, text only. Following their links led to more than 15 sites, and some of the articles were in Spanish or other languages.
- The obvious models didn't work well enough. The team's first classifiers for hazards and solutions were weak: the machine-learning methods scored under 50% accuracy, and deep-learning methods only slightly better.
- Nobody was coordinating. More than 40 volunteers from 15+ countries worked across time zones, each with their own data-cleaning scripts at first. Work only happened when someone picked a problem and finished it.
The model: three questions, one traceable graph
The volunteers split the problem into three workstreams, each answering a different question WRI's analysts would ask:
- Network analysis. Who are a platform's most influential partners, and what's the smallest set of partners that could spread information across its whole network?
- Hazard–solution mapping. For a given place, which climate hazards come up most, which solutions are used against them, and which countries have dealt with similar problems?
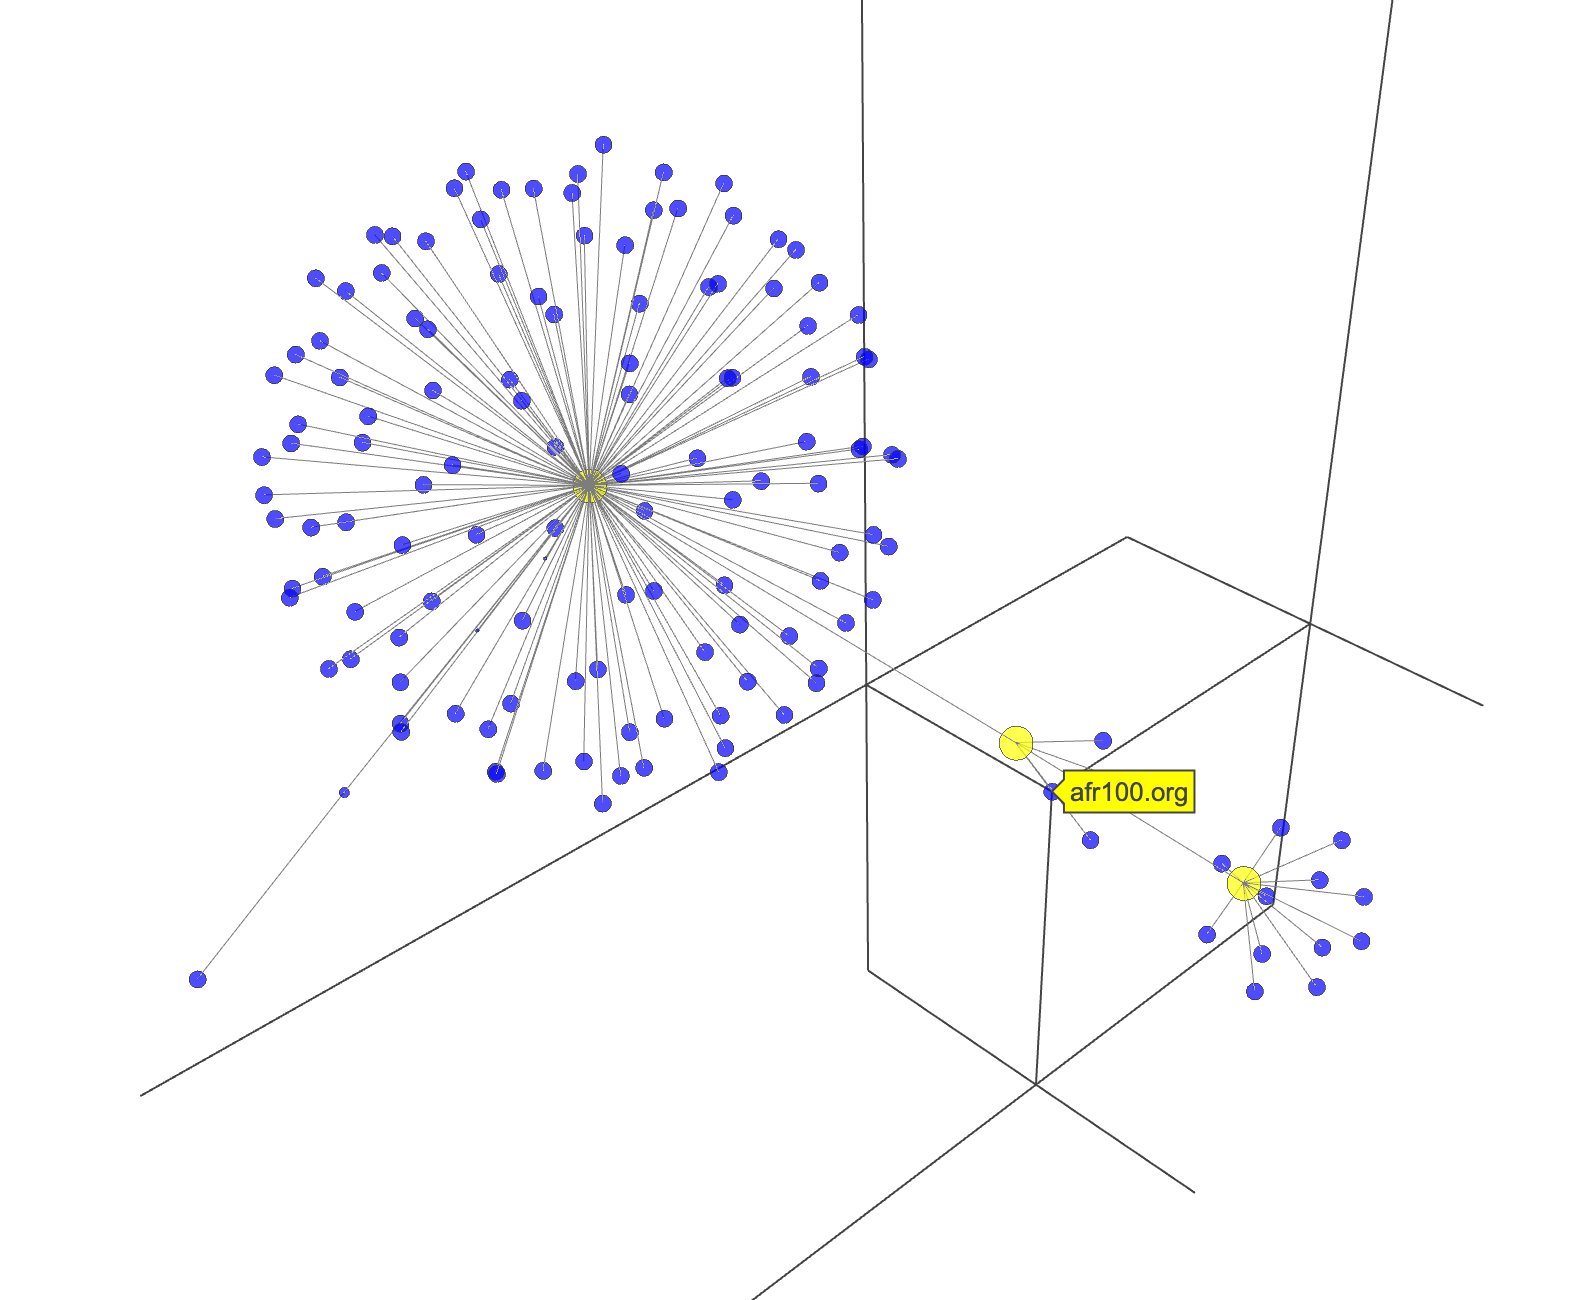
- A knowledge graph, which is where I worked: a searchable, domain-specific wiki that WRI's team could query by organisation, place or topic.
How the knowledge graph worked
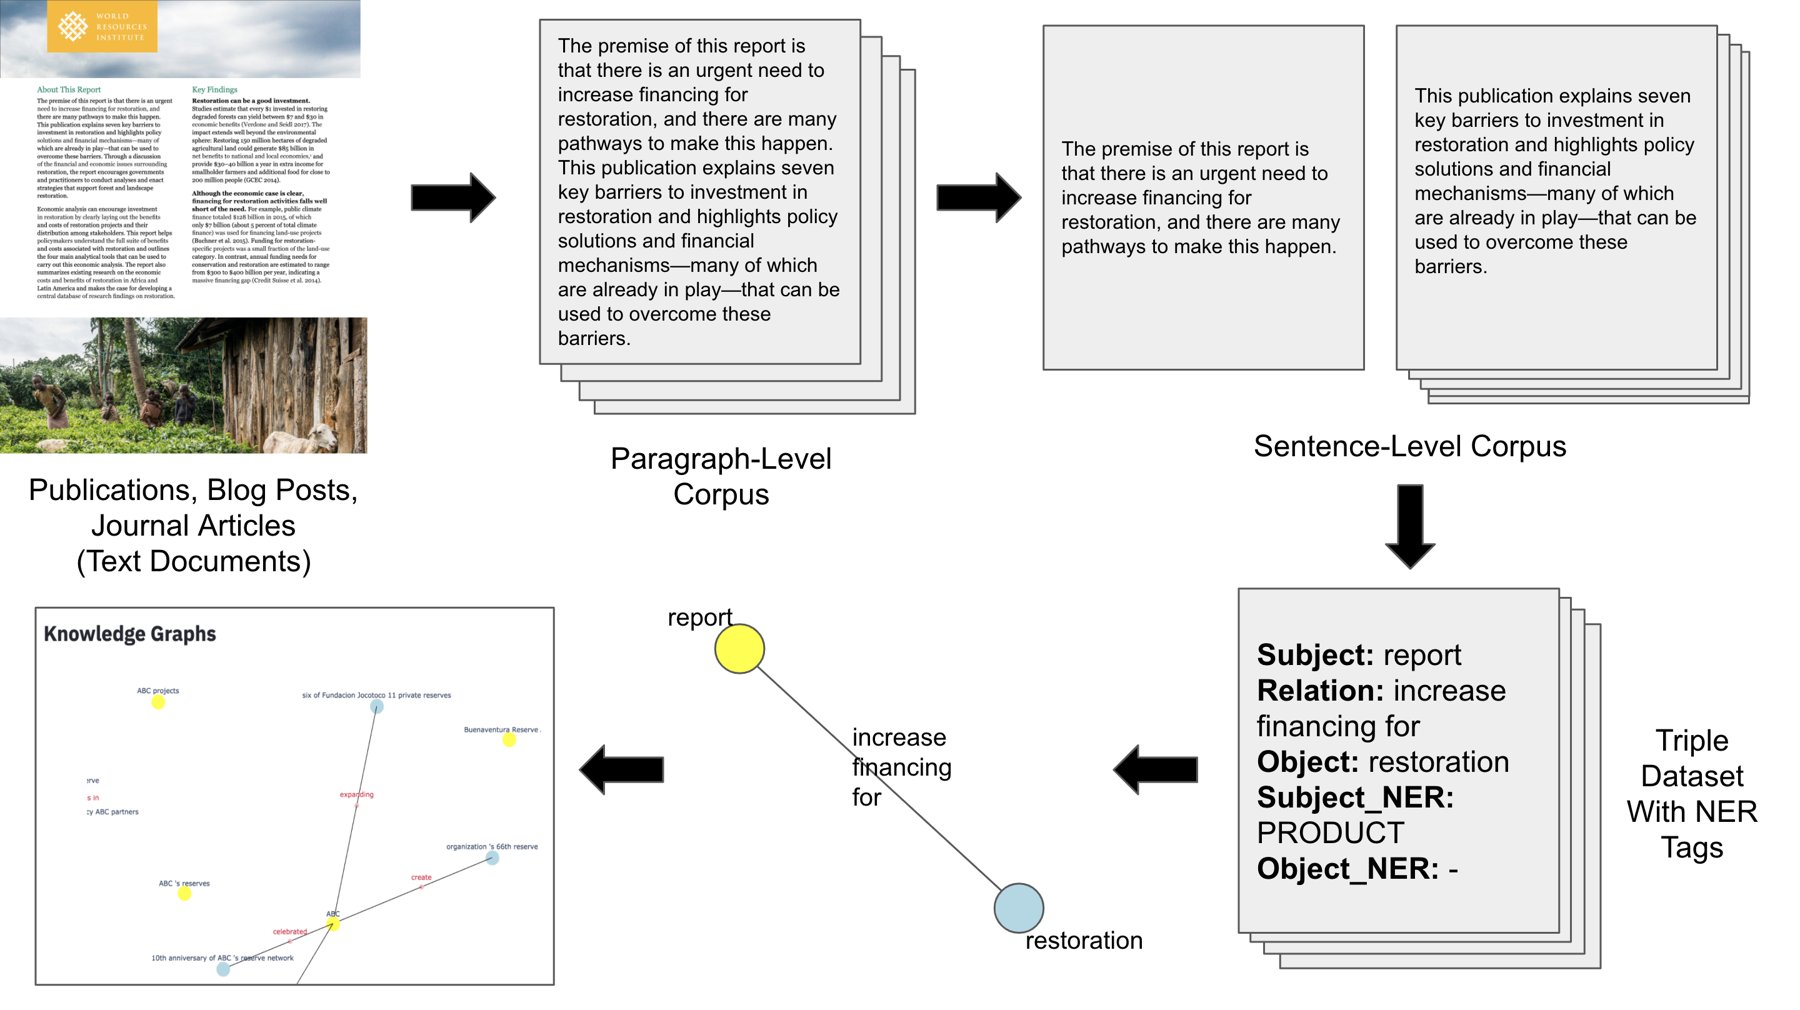
Split documents into sentences
spaCy broke each paragraph into sentences, and every sentence kept a link back to its source page so any fact in the graph could be traced.
Extract subject, relation, object
Stanford's Open Information Extraction turned each sentence into a triple. "Barack Obama was born in Hawaii" becomes (Barack Obama, was born in, Hawaii). Where a sentence produced several, we kept the longest to keep the prototype simple.
Tag the entities twice
Each subject and object went through two named-entity models, spaCy and Flair, tagging them into 18 categories such as organisation, place, date and quantity. Both were trained on the same data but built differently, so using both caught more than either alone. Our target was a tag on at least 70% of sentences, and five filters removed triples that didn't qualify.
Build the graph
Subjects and objects became nodes and relations became edges. I chose the NER models, built the visualisations with Plotly and NetworkX, deployed two Streamlit demos to Heroku, and wrote the documentation.
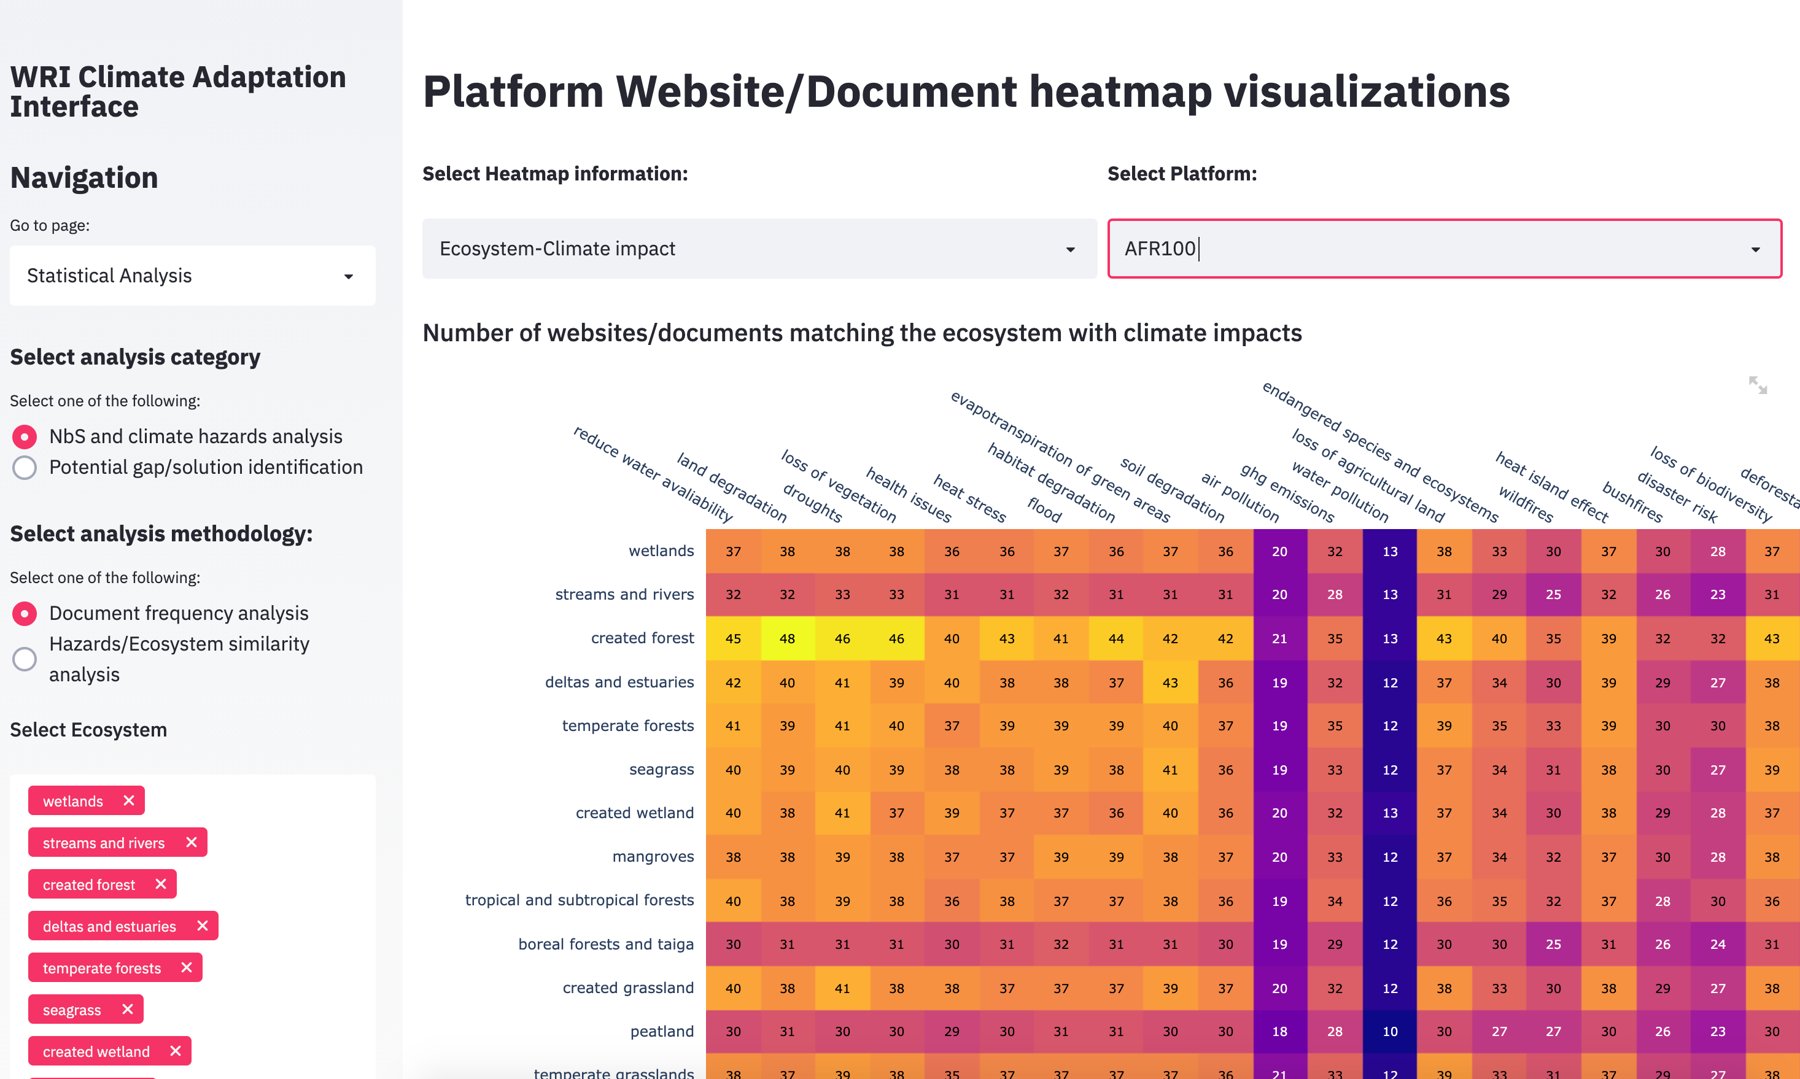
We worked on building an NLP pipeline that processed over 50k rows of text into Subject-Object-Relation triplets for a knowledge graph. During this process, Tony was involved in 2 components - model selection for NER tagging and data visualisation using Python's plotly and networkx. He also provided comprehensive documentation for the same. He provides his own insights and creative inputs, over and above the assigned work - a pleasure to work with.
The structure: rules where the models failed
Midway through, shorter sentences were clearly giving cleaner triples, so the plan was to simplify long sentences before extraction. At least three open-source "split and rephrase" models were tried, and none could be made to run: the project notes from that week record that the techniques were "hard to replicate", with "lots of dependencies" and unclear repositories.
So the pipeline got hand-written rules instead, built on noun phrases and dependency trees and checked sentence by sentence. It was less elegant and it worked better than what the team had. The same pattern shaped the whole graph: every fact kept a link to the sentence and page it came from, so an analyst could check a weak extraction rather than trust it.
Coordination worked the same way. With no project manager, the team began in chaos and gradually organised itself into clusters around the three workstreams, each breaking its work into pieces small enough for one volunteer to own. In the post written when the project ended:
"An analogy would be the 'Big Bang', where we begin with chaos, and gradually self-organise into clusters, breaking down tasks into manageable chunks."
The result
- A working prototype. More than 50,000 rows of text processed into subject–relation–object triples, a knowledge graph WRI's team could explore by organisation, place or topic, and two Streamlit demos deployed to Heroku.
- Published by the team. Several teammates wrote up the project's results on Omdena's blog in January 2021, including the knowledge graph built on Stanford's OpenIE.
- Shared inside Rakuten. The same month, the project was presented to Rakuten's engineering team as an internal tech-sharing session, "NLP Applications in Climate Change".
- Limits stated, not hidden. Off-the-shelf entity models missed niche terms such as "cities4forest", and many nodes meant nearly the same thing and should have been merged. Both were handed over as next steps.
Two later Omdena projects, briefly
Weed detection for WeedBot (Dec 2020 – Feb 2021). WeedBot, a European startup working towards pesticide-free food production, needed computer vision that could tell crops from weeds fast enough to run on hardware in the field. The contribution here was data annotation and documentation, the unglamorous work that a project with dozens of rotating volunteers depends on. The team's work, as Omdena reports it, reached 1–2 mm recognition precision at 12 milliseconds per image or faster. WeedBot went on to build Lumina, a laser weeder, and according to Research Latvia sold its first machine to an organic carrot grower in Belgium in spring 2026.
Fine-tuning an open-source model (Apr – Aug 2023). On a later Omdena chatbot project, the task was to test whether an open-source language model could be trained on the team's own data instead of a paid API. Meta's LLaMA 7B was fine-tuned with LoRA on about 5,000 instruction-and-response pairs from cleaned conversation transcripts, for around S$4–5 of compute per run. The model got worse, not better: it learned to talk like the people in the transcripts rather than give useful answers. Fine-tuning mostly teaches a style, not facts, and it learns whichever role dominates the data.
What carries over
- Ownership beats instructions. On a team where nobody assigns work, the people who pick a problem and finish it end up shaping the project. That's also how most small businesses run.
- The boring work matters most. Labels, documentation and clear handovers did more for those projects than any clever model choice.
- Ship the version that works. Hand-written rules beat three sophisticated models that couldn't be made to run.
- Training your own model is rarely the first step. It was cheap to try, and the result showed why. Good data and the right design matter more than owning the model.
- Turning documents into structured knowledge is an old problem. In 2020 it took a pipeline of several models to pull facts out of reports. Today a language model can do much of it in one step, but the questions haven't changed: can you trace each fact to its source, and do you know where it's weak? It's the same idea behind my private search engine for my notes.
Originally posted on LinkedIn
My post after finishing the World Resources Institute project, December 2020. 49 reactions.